Living in Ballantyne, Charlotte NC (2026)
A billion-dollar corporate campus turning itself into a walkable town center, surrounded by golf-course subdivisions and highway retail.
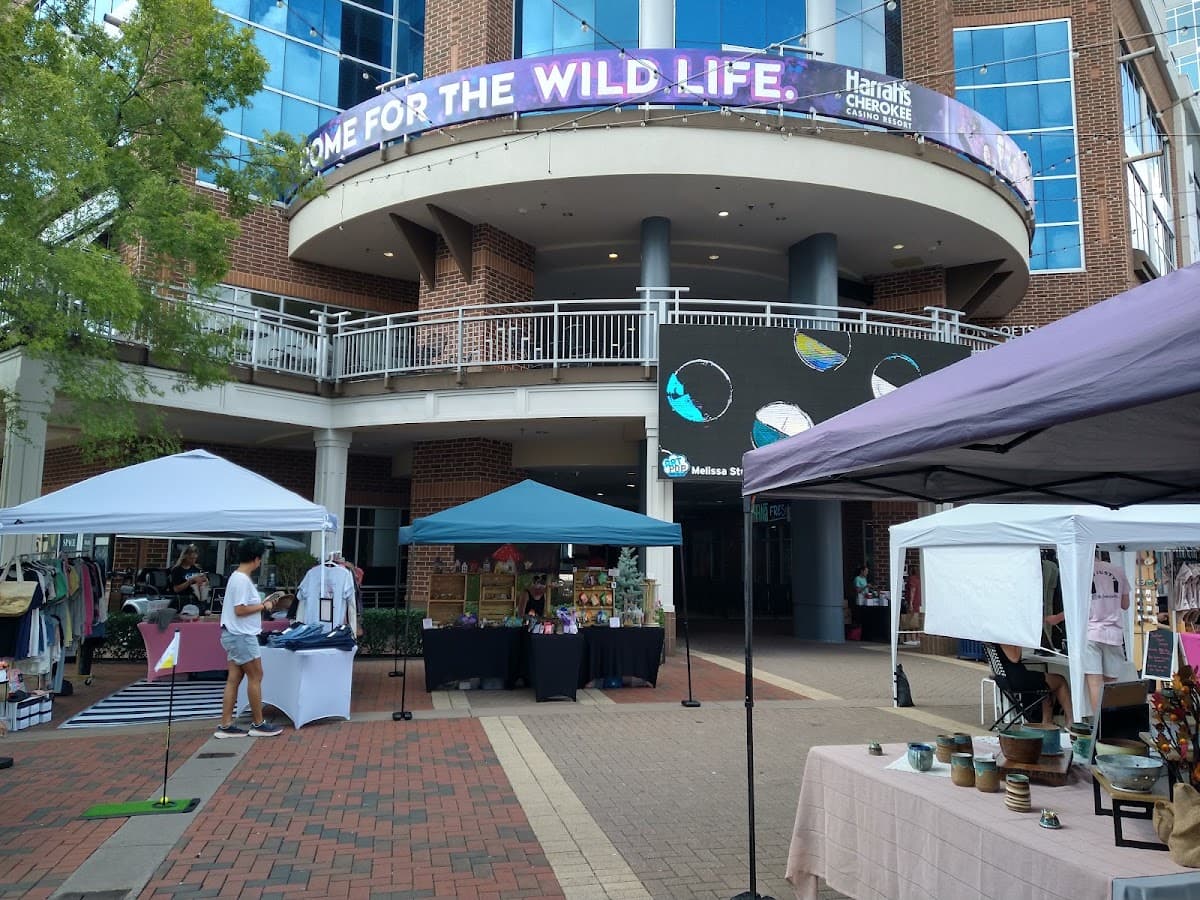
Ballantyne Village
About the area
Ballantyne occupies the far southern edge of Charlotte, where rings of brick colonials and townhomes surround a business district built almost entirely since the 1990s. The neighborhood's identity is inseparable from Ballantyne Corporate Park, the roughly 2,000-acre office campus Northwood Office bought for more than $1 billion in 2017 and has been converting into a denser mixed-use core under the banner Ballantyne Reimagined. What began as a golf-course business park now includes a retail and entertainment hub called The Bowl, an amphitheater, a stream-side park, and a cluster of new apartment high-rises rising over former parking lots.
Beyond the corporate campus, Ballantyne reads as classic south Charlotte suburbia: HOA-governed subdivisions, strip-mall shopping along Johnston Road and Rea Road, chain restaurants, and large public and private schools drawing families from across the region. Ballantyne Village supplies an older, walkable town-center alternative with boutiques and patio dining, serving a role similar to the newer Bowl development a short drive away.
Quick facts
Neighborhood vs Charlotte citywide. Walkability is rated Green / Orange / Red from its percentile among Charlotte planning areas.
| Metric | This area | Charlotte citywide |
|---|---|---|
| Median home sales price | $550,918 | $489,824 |
| Median household income | $125,513 | $98,184 |
| Median age | 37.9 | 36.4 |
| Population | 27,129 | 1,154,681 |
| Walkability (EPA) | 8.9Typical | 10.4Typical |
Demographics
Figures come from the U.S. Census Bureau's American Community Survey (ACS) 5-year estimates for Ballantyne vs Charlotte citywide. ACS is an ongoing Census survey; the 5-year product pools recent responses so smaller neighborhoods have more stable estimates than a single year.
| Metric | This area | Charlotte citywide |
|---|---|---|
| Median household income | $125,513 | $98,184 |
| Median age | 37.9 | 36.4 |
| Population | 27,129 | 1,154,681 |
| Owner-occupied | 57.2% | 57.2% |
Amenities
City of Charlotte proximity scores, EPA walkability, and city crime rates for Ballantyne vs Charlotte citywide. Each figure is rated Green / Orange / Red from its percentile among Charlotte planning areas (configurable in admin). Crime rates are reported-incident indicators, not a safe/unsafe verdict. Read how to read Charlotte crime rates and methodology.
- Grocery proximity
- 48.5Typical
Charlotte 37.5Typical
- Transit proximity
- 61.7Typical
Charlotte 74.4Typical
- Tree canopy
- 51.8Typical
Charlotte 46.7Typical
- Walkability
- 8.9Typical
Charlotte 10.4Typical
- Violent crime rate
- 0.7Strong
Charlotte 4.4Typical
- Property crime rate
- 14.3Typical
Charlotte 32.9Typical
City of Charlotte
City of Charlotte
City of Charlotte
EPA
City of Charlotte
City of Charlotte
Reading the data
Ballantyne's public data shows a neighborhood priced below the Charlotte median despite its newer housing stock and corporate address. QoL home sales indicators put the population-weighted median sales price at $371,098, versus $474,833 citywide, a gap of more than $100,000. That's counterintuitive for a neighborhood synonymous with a billion-dollar redevelopment, and it reflects the housing mix: golf-course estates sit alongside a large stock of townhomes and mid-market subdivisions built for volume, plus new-construction units still working through initial sales cycles.
Household income sits near parity rather than a premium: ACS estimates put Ballantyne at $89,911, just under the citywide $94,896. Combined with a median age of 33.6 and a population of roughly 13,927, the numbers describe a younger, family-forming area rather than an empty-nester enclave.
Walkability is where Ballantyne diverges most from the city average: an EPA score of 8.8 against Charlotte's 10.6 confirms this is a drive-to neighborhood outside the Bowl and Ballantyne Village pockets, despite the urbanist ambitions of Ballantyne Reimagined.
Relocation notes
Ballantyne is built for cars. I-485 forms the neighborhood's southern and eastern edge, and most daily trips, to Ballantyne Corporate Park offices, to Johnston Road retail, to CMS schools, run through arterials like Johnston, Rea, and Ballantyne Commons Parkway rather than a walkable grid. Uptown commutes typically run 25 to 40 minutes depending on traffic; there is no rail service, and bus routes are limited.
That car dependence buys newer housing stock, larger lots, and direct highway access to the airport and to job growth in Fort Mill and Indian Land just across the state line. Relocating families should budget for a second vehicle and confirm CMS school assignment first, since Ballantyne spans multiple zones. The Bowl and Ballantyne Village supplement, rather than replace, a car-based routine. Compare commute patterns against Steele Creek or SouthPark if highway access to a specific employer matters more than walkability.
Data limitations
This profile is informational, not real estate, legal, or investment advice. Ballantyne's boundaries follow official planning areas, not the informal footprint locals or HOAs use, so some streets residents call Ballantyne may fall outside our polygon and vice versa. Home sales and ACS figures are population-weighted estimates with their own vintages and margins of error, not live MLS data. Verify school assignment and HOA details directly before deciding.
Research Ballantyne by goal
Match lifestyle, budget, or hazard questions to Charlotte-wide guides, then return to this profile for local tables and map deep links.
Nearby schools
Charlotte-Mecklenburg Schools (CMS) campuses near Ballantyne. Exact assignment depends on your address. Verify with the CMS school locator and NC DPI report cards for ratings. We list names and levels only.
Elementary
- Ballantyne0.9 mi
- Endhaven1.4 mi
- Hawk Ridge1.5 mi
Middle
- Community House1.8 mi
High
- Ballantyne Ridge1.7 mi
- Ardrey Kell2.0 mi
FAQ
What is the median home price in Ballantyne, Charlotte NC?
According to City of Charlotte home sales data as of 2023, Ballantyne has a median home sales price of about $550,918, compared with roughly $489,824 Charlotte citywide. Figures are city sales indicators, not an MLS median.
What is the median household income in Ballantyne?
U.S. Census Bureau American Community Survey (ACS) 5-year estimates for Ballantyne show a median household income of about $125,513 (ACS 2024) (Charlotte citywide ≈ $98,184). Small-area ACS estimates have sampling error; treat as directional.
How walkable is Ballantyne?
For Ballantyne, the EPA National Walkability Index is 8.9 on a 1–20 scale (Orange: Typical among Charlotte planning areas), EPA vintage 2021. Walkability: Orange (Typical) vs Charlotte NPAs — higher scores rank better. Open the walkability layer on the map for spatial context.
Is Ballantyne a good place to live in Charlotte?
Fit depends on budget, commute, and priorities. Ballantyne’s median sales price ($550,918) compares to the Charlotte citywide figure ($489,824). Use Know Charlotte to compare demographics, walkability, and adjacent neighborhoods; we report public data, not buy/sell advice.
Where is Ballantyne on the Charlotte map?
Open the interactive Charlotte neighborhood map and jump to this area via the explore link on this page. Map selection uses planning area 151; see methodology for how named neighborhoods relate to official planning boundaries.
Nearby & similar
Similar housing & demographics
Closest on price, income, age, and walkability (excluding nearby)
Explore on the interactive map
Sources: Data sources · Methodology. Page reviewed 2026-09-05.