Living in Cotswold, Charlotte NC (2026)
A mid-century brick-ranch grid built around one of Charlotte's hardest-working shopping centers, with a walk score that outperforms its price tag.
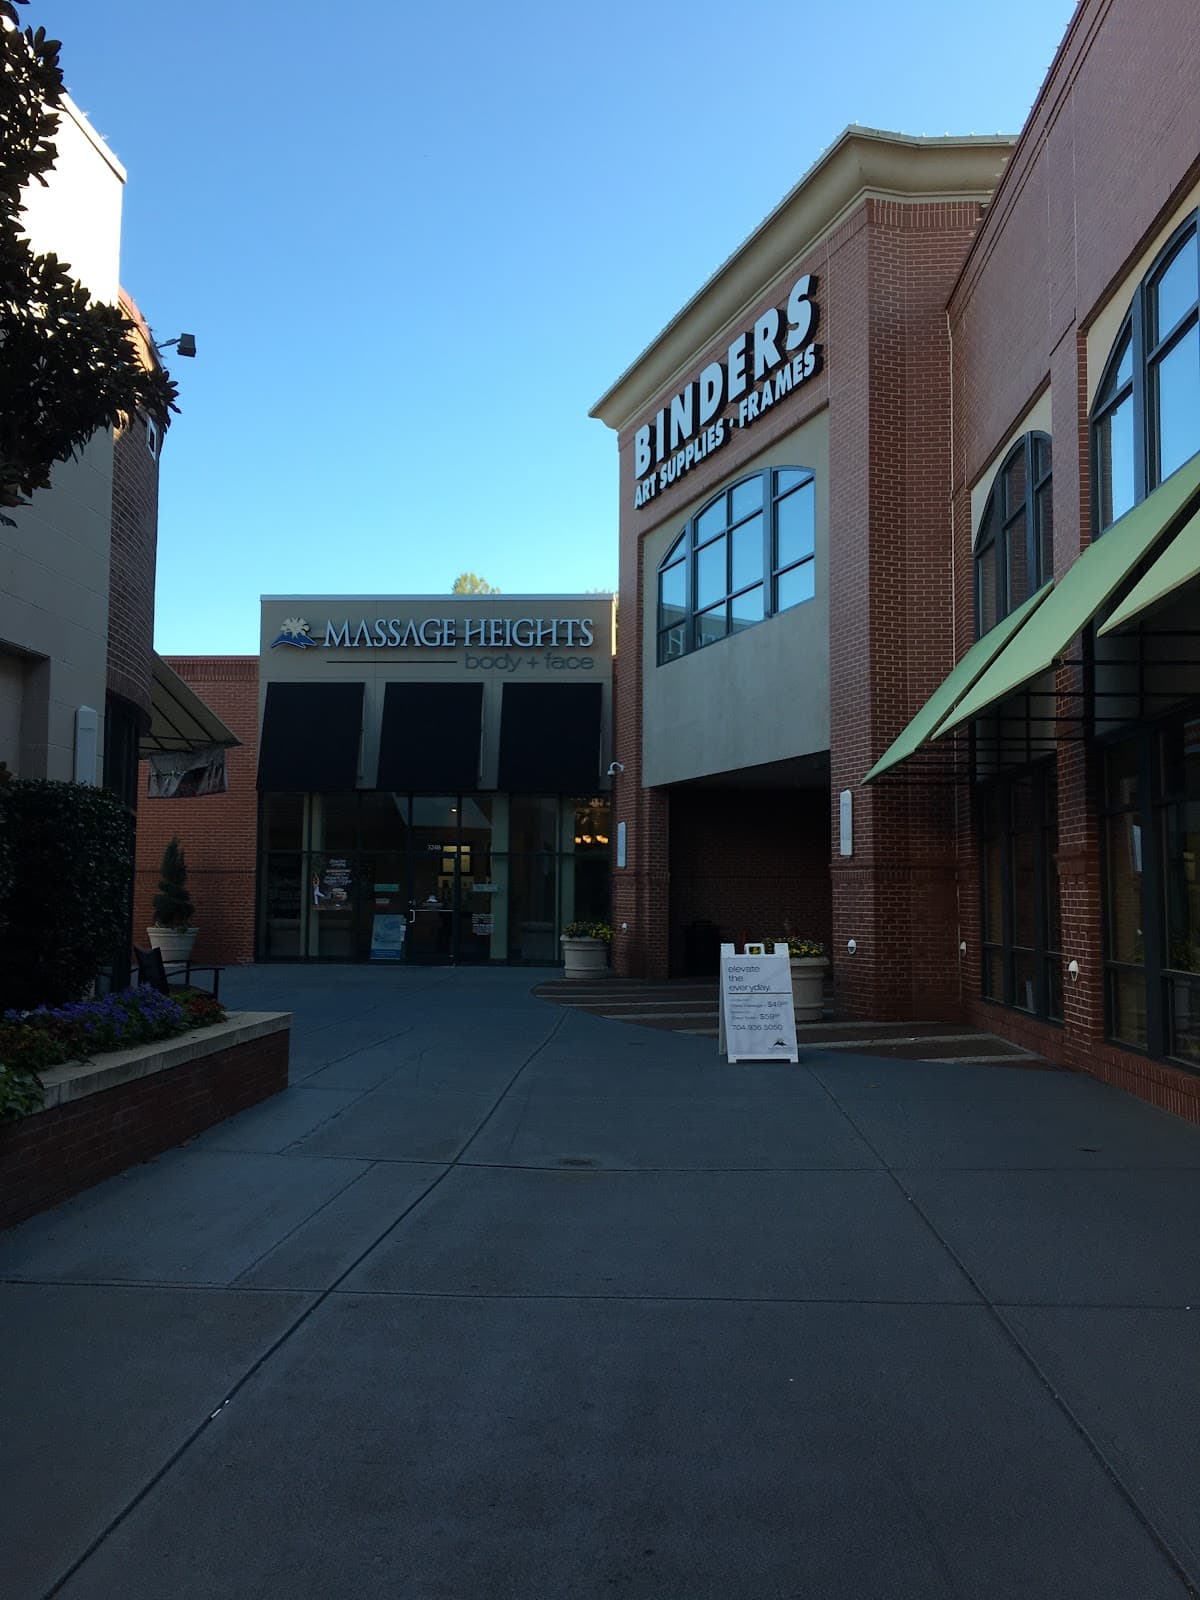
Cotswold Village
About the area
Cotswold sits east of Uptown along Randolph and Sharon Amity roads, a neighborhood platted in the 1950s and 1960s as one of Charlotte's early postwar suburbs. The streets read like a textbook of mid-century suburban planning: brick ranches and split-levels on curving lots, mature oaks that predate the houses beneath them, and a scale that favors walking to the corner more than driving across town. That corner is Cotswold Village, the Harris Teeter-anchored shopping center at Randolph and Sharon Amity that has anchored the neighborhood since 1958 and is now mid-renovation under owner Asana Partners. A Publix sits directly across Randolph Road, giving residents two full grocery options within a few blocks of home.
South of the houses, McMullen Creek Greenway threads a paved, tree-shaded path toward the larger McAlpine Creek system, a quieter counterpoint to the shopping-center bustle.
Quick facts
Neighborhood vs Charlotte citywide. Walkability is rated Green / Orange / Red from its percentile among Charlotte planning areas.
| Metric | This area | Charlotte citywide |
|---|---|---|
| Median home sales price | $502,671 | $489,824 |
| Median household income | $123,179 | $98,184 |
| Median age | 38.2 | 36.4 |
| Population | 11,887 | 1,154,681 |
| Walkability (EPA) | 12.7Strong | 10.4Typical |
Demographics
Figures come from the U.S. Census Bureau's American Community Survey (ACS) 5-year estimates for Cotswold vs Charlotte citywide. ACS is an ongoing Census survey; the 5-year product pools recent responses so smaller neighborhoods have more stable estimates than a single year.
| Metric | This area | Charlotte citywide |
|---|---|---|
| Median household income | $123,179 | $98,184 |
| Median age | 38.2 | 36.4 |
| Population | 11,887 | 1,154,681 |
| Owner-occupied | 54.6% | 57.2% |
Amenities
City of Charlotte proximity scores, EPA walkability, and city crime rates for Cotswold vs Charlotte citywide. Each figure is rated Green / Orange / Red from its percentile among Charlotte planning areas (configurable in admin). Crime rates are reported-incident indicators, not a safe/unsafe verdict. Read how to read Charlotte crime rates and methodology.
- Grocery proximity
- 37.4Typical
Charlotte 37.5Typical
- Transit proximity
- 91.2Typical
Charlotte 74.4Typical
- Tree canopy
- 38.5Typical
Charlotte 46.7Typical
- Walkability
- 12.7Strong
Charlotte 10.4Typical
- Violent crime rate
- 0.9Strong
Charlotte 4.4Typical
- Property crime rate
- 16.2Typical
Charlotte 32.9Typical
City of Charlotte
City of Charlotte
City of Charlotte
EPA
City of Charlotte
City of Charlotte
Reading the data
The numbers behind Cotswold come with a caveat that matters more than usual: the population sample underlying this pocket is just 638 people, small enough that ACS estimates carry a wide margin of error here. Dollar figures should be read as directional, not exact. With that caveat, Cotswold's median home price lands at $234,593, well below Charlotte's citywide median of $474,833. That gap likely reflects the small sample skewing toward an older, previously built cluster of homes rather than the renovated properties now common on nearby streets. Median household income of $83,646 also runs below the citywide figure of $94,896, again worth treating with caution given the sample size.
The distinctive figure is walkability. Cotswold's index of 19.0 nearly doubles Charlotte's citywide average of 10.6, unusual for a mid-century, ranch-house neighborhood. This one is not a small-sample artifact: it reflects a genuine grid of connected streets and a shopping center within walking distance of most homes. Median age of 35.1 points to a mix of young families and long-tenured owners.
Compared with neighboring SouthPark, whose towers and luxury retail pull prices and incomes well above the city average, Cotswold reads as a lower-cost, lower-key alternative just minutes away.
Relocation notes
Cotswold suits buyers who want walkability without paying SouthPark prices for it. The neighborhood sits a few minutes from SouthPark's malls and office towers and roughly ten minutes from Uptown via Randolph Road, close enough for a commute without living inside the density. Housing stock is dominated by 1950s and 1960s brick ranches and split-levels, many since renovated, so buyers should expect a mix of untouched originals and heavily updated flips on the same block, and should budget for inspection surprises on older plumbing and wiring.
Households with kids or dogs benefit most from Cotswold Village's daily-needs shopping, the Publix across the street, and McMullen Creek Greenway a short walk or drive south. Renters will find fewer options than in denser SouthPark-adjacent corridors.
Data limitations
Home price and income figures come from a Census sample of only 638 residents, which produces a wide margin of error for this specific pocket. Treat dollar figures as directional rather than precise, and verify against current listings or a local agent before making a purchase decision. Walk index and greenway proximity are measured from fixed geography and are more reliable. Boundaries used here are approximate and don't correspond to any official planning designation.
Research Cotswold by goal
Match lifestyle, budget, or hazard questions to Charlotte-wide guides, then return to this profile for local tables and map deep links.
Nearby schools
Charlotte-Mecklenburg Schools (CMS) campuses near Cotswold. Exact assignment depends on your address. Verify with the CMS school locator and NC DPI report cards for ratings. We list names and levels only.
Elementary
- Cotswold0.4 mi
- Rama Road1.2 mi
- Oakhurst Steam Academy1.3 mi
Middle
- Randolph0.5 mi
- Mcclintock1.3 mi
- Alexander Graham2.4 mi
High
- East Mecklenburg1.9 mi
- Myers Park2.4 mi
FAQ
What is the median home price in Cotswold, Charlotte NC?
According to City of Charlotte home sales data as of 2023, Cotswold has a median home sales price of about $502,671, compared with roughly $489,824 Charlotte citywide. Figures are city sales indicators, not an MLS median.
What is the median household income in Cotswold?
U.S. Census Bureau American Community Survey (ACS) 5-year estimates for Cotswold show a median household income of about $123,179 (ACS 2024) (Charlotte citywide ≈ $98,184). Small-area ACS estimates have sampling error; treat as directional.
How walkable is Cotswold?
For Cotswold, the EPA National Walkability Index is 12.7 on a 1–20 scale (Green: Strong among Charlotte planning areas), EPA vintage 2021. Walkability: Green (Strong) vs Charlotte NPAs — higher scores rank better. Open the walkability layer on the map for spatial context.
Is Cotswold a good place to live in Charlotte?
Fit depends on budget, commute, and priorities. Cotswold’s median sales price ($502,671) compares to the Charlotte citywide figure ($489,824). Use Know Charlotte to compare demographics, walkability, and adjacent neighborhoods; we report public data, not buy/sell advice.
Where is Cotswold on the Charlotte map?
Open the interactive Charlotte neighborhood map and jump to this area via the explore link on this page. Map selection uses planning area 28; see methodology for how named neighborhoods relate to official planning boundaries.
Nearby & similar
Nearby neighborhoods
Shared or touching neighborhood boundaries
Similar housing & demographics
Closest on price, income, age, and walkability (excluding nearby)
Explore on the interactive map
Sources: Data sources · Methodology. Page reviewed 2026-09-05.