Living in South End, Charlotte NC (2026)
A former mill and rail corridor turned Charlotte's densest walk-to-everything district: converted warehouses, brewery patios, and the Blue Line define apartment-heavy city living.
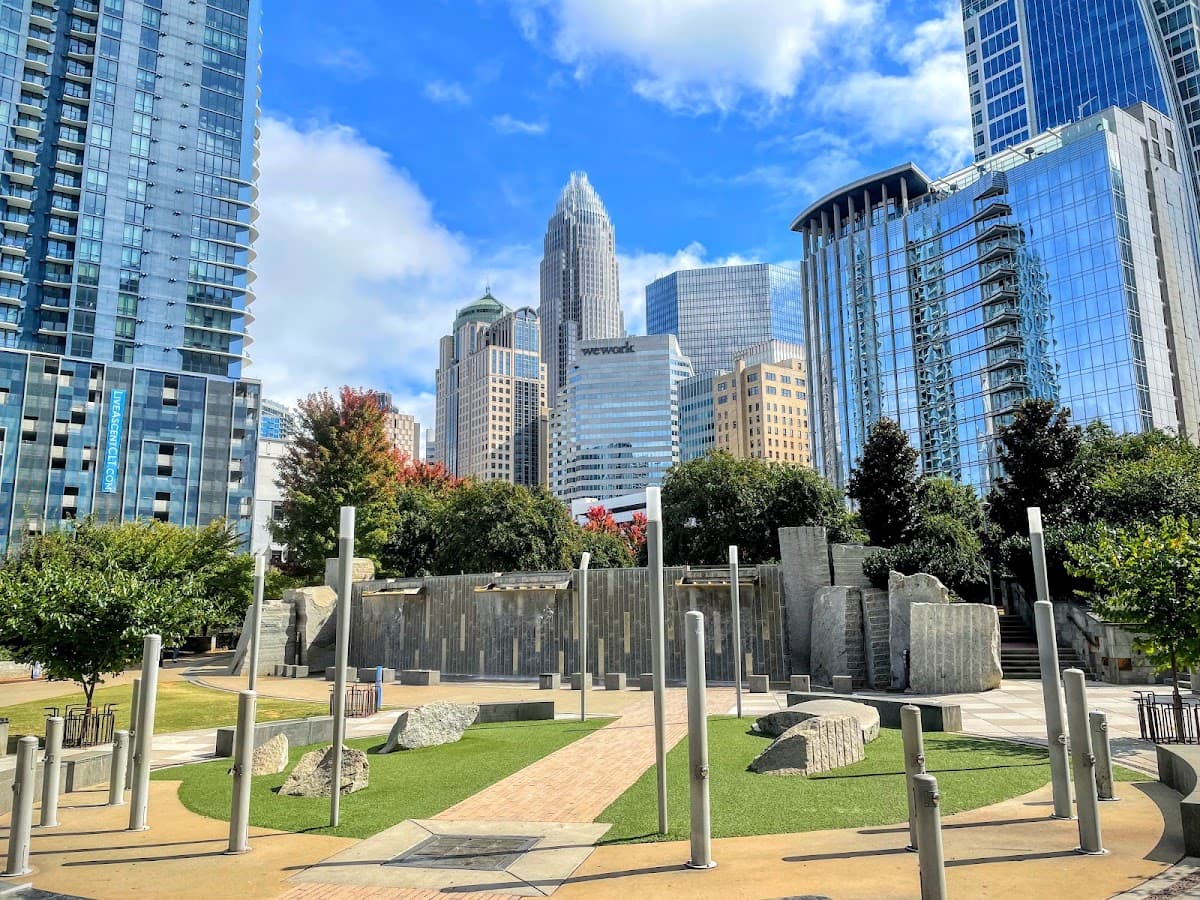
Romare Bearden Park
About the area
South End grew up along the old Southern Railway corridor. Early 1900s cotton mills and textile warehouses anchored a working-class rail district just south of Uptown. Many of those brick mill buildings still stand, now converted into apartments, breweries, and creative office space instead of torn down. The neighborhood's modern identity took shape after the LYNX Blue Line opened along the former rail bed in 2007, turning light-industrial land into one of Charlotte's fastest-changing districts.
Today the area is dense and built for people who don't want a car for daily errands. The Charlotte Rail Trail runs the length of the neighborhood, linking brewery patios at Sycamore and VBGB, the shipping-container market at Design Center of the Carolinas, and the Atherton Mill retail block, once a cotton mill, now home to a Sunday farmers market. Cranes remain a constant feature as new apartment towers rise along South Tryon and South Boulevard.
Quick facts
Neighborhood vs Charlotte citywide. Walkability is rated Green / Orange / Red from its percentile among Charlotte planning areas.
| Metric | This area | Charlotte citywide |
|---|---|---|
| Median home sales price | $592,218 | $489,824 |
| Median household income | $88,616 | $98,184 |
| Median age | 28.1 | 36.4 |
| Population | 8,964 | 1,154,681 |
| Walkability (EPA) | 16.1Strong | 10.4Typical |
Demographics
Figures come from the U.S. Census Bureau's American Community Survey (ACS) 5-year estimates for South End vs Charlotte citywide. ACS is an ongoing Census survey; the 5-year product pools recent responses so smaller neighborhoods have more stable estimates than a single year.
| Metric | This area | Charlotte citywide |
|---|---|---|
| Median household income | $88,616 | $98,184 |
| Median age | 28.1 | 36.4 |
| Population | 8,964 | 1,154,681 |
| Owner-occupied | 13.1% | 57.2% |
Amenities
City of Charlotte proximity scores, EPA walkability, and city crime rates for South End vs Charlotte citywide. Each figure is rated Green / Orange / Red from its percentile among Charlotte planning areas (configurable in admin). Crime rates are reported-incident indicators, not a safe/unsafe verdict. Read how to read Charlotte crime rates and methodology.
- Grocery proximity
- 54.4Typical
Charlotte 37.5Typical
- Transit proximity
- 99.9Typical
Charlotte 74.4Typical
- Tree canopy
- 13.5Typical
Charlotte 46.7Typical
- Walkability
- 16.1Strong
Charlotte 10.4Typical
- Violent crime rate
- 8.2Weak
Charlotte 4.4Typical
- Property crime rate
- 96.6Weak
Charlotte 32.9Typical
City of Charlotte
City of Charlotte
City of Charlotte
EPA
City of Charlotte
City of Charlotte
Reading the data
South End's housing costs run well above the city as a whole. Charlotte's Quality of Life survey puts the median home sale price at roughly $579,696, about 22% higher than the citywide median of $474,833. That premium reflects new mid-rise construction and mill-to-residential conversions rather than the older, larger-lot single-family stock common in historic neighborhoods.
Household income shows a smaller gap. American Community Survey figures put median household income near $102,521 in South End, about 8% above the citywide median of $94,896, consistent with a renter-heavy population of young professionals rather than high-equity homeowners.
Walkability is the sharpest contrast. The EPA's National Walkability Index scores South End at roughly 13.7, versus 10.6 citywide, a gap of about 29%. That lines up with the demographics: a median age of 34.4 and a population near 8,878, both typical of a district built around the Rail Trail and the Blue Line rather than a car.
Dilworth, just east across South Boulevard, was built a century earlier as a streetcar suburb of single-family bungalows. It carries a lower walkability score despite sitting just as close to Uptown. South End's higher score comes from mixed-use density, apartments stacked over retail, not from a historic street grid.
Relocation notes
South End suits renters and young professionals who want a car-optional lifestyle. The LYNX Blue Line runs the length of the neighborhood with stops at New Bern, East/West Boulevard, and Bland Street, putting Uptown roughly 10 minutes away by rail. The Rail Trail parallels the tracks for walking and biking, and most daily errands, groceries, breweries, coffee, gyms, are reachable on foot.
The tradeoffs are density and cost. Housing skews toward apartments and condos, so buyers wanting yard space or top-rated schools typically look toward Dilworth, Wilmore, or the suburbs instead. Construction noise and cranes are a near-permanent backdrop, and traffic on South Boulevard and South Tryon gets heavy at peak hours. It fits singles, couples, and Uptown commuters better than families needing more space.
Data limitations
These figures come from Charlotte's Quality of Life survey, Census ACS estimates, and the EPA's Walkability Index, each using its own boundary definitions and collection years, so they may not update in sync. South End's data boundary is drawn for planning purposes and may not match where locals think the neighborhood starts or ends, particularly near Dilworth, Wilmore, and Uptown. This information is for general research only and is not financial, real estate, or relocation advice.
Research South End by goal
Match lifestyle, budget, or hazard questions to Charlotte-wide guides, then return to this profile for local tables and map deep links.
Nearby schools
Charlotte-Mecklenburg Schools (CMS) campuses near South End. Exact assignment depends on your address. Verify with the CMS school locator and NC DPI report cards for ratings. We list names and levels only.
Elementary
- Charles H Parker Academic Center1.2 mi
- Sedgefield Montessori1.5 mi
- Bruns Avenue1.9 mi
Middle
- Jt Williams Secondary Montessori0.8 mi
- Sedgefield1.3 mi
High
- Central Piedmont Early College2.2 mi
- Phillip O. Berry Academy Of Technology2.3 mi
FAQ
What is the median home price in South End, Charlotte NC?
According to City of Charlotte home sales data as of 2023, South End has a median home sales price of about $592,218, compared with roughly $489,824 Charlotte citywide. Figures are city sales indicators, not an MLS median.
What is the median household income in South End?
U.S. Census Bureau American Community Survey (ACS) 5-year estimates for South End show a median household income of about $88,616 (ACS 2024) (Charlotte citywide ≈ $98,184). Small-area ACS estimates have sampling error; treat as directional.
How walkable is South End?
For South End, the EPA National Walkability Index is 16.1 on a 1–20 scale (Green: Strong among Charlotte planning areas), EPA vintage 2021. Walkability: Green (Strong) vs Charlotte NPAs — higher scores rank better. Open the walkability layer on the map for spatial context.
Is South End a good place to live in Charlotte?
Fit depends on budget, commute, and priorities. South End’s median sales price ($592,218) compares to the Charlotte citywide figure ($489,824). Use Know Charlotte to compare demographics, walkability, and adjacent neighborhoods; we report public data, not buy/sell advice.
Where is South End on the Charlotte map?
Open the interactive Charlotte neighborhood map and jump to this area via the explore link on this page. Map selection uses planning area 30; see methodology for how named neighborhoods relate to official planning boundaries.
Nearby & similar
Nearby neighborhoods
Shared or touching neighborhood boundaries
Similar housing & demographics
Closest on price, income, age, and walkability (excluding nearby)
Explore on the interactive map
Sources: Data sources · Methodology. Page reviewed 2026-09-05.